
| Sample 8 FIT |
DLG(E='#Explain', B='OK')
SET(arr=shapes(), $name=" ", $theory=" ", parms=" ", xAtoxZ=" ", $startAt=0, $endAt=0, $stepsize=0)
LOAD("LeastSquareFit.Settings",shapes)
DO test = 1, 1000
$FUNC = 0
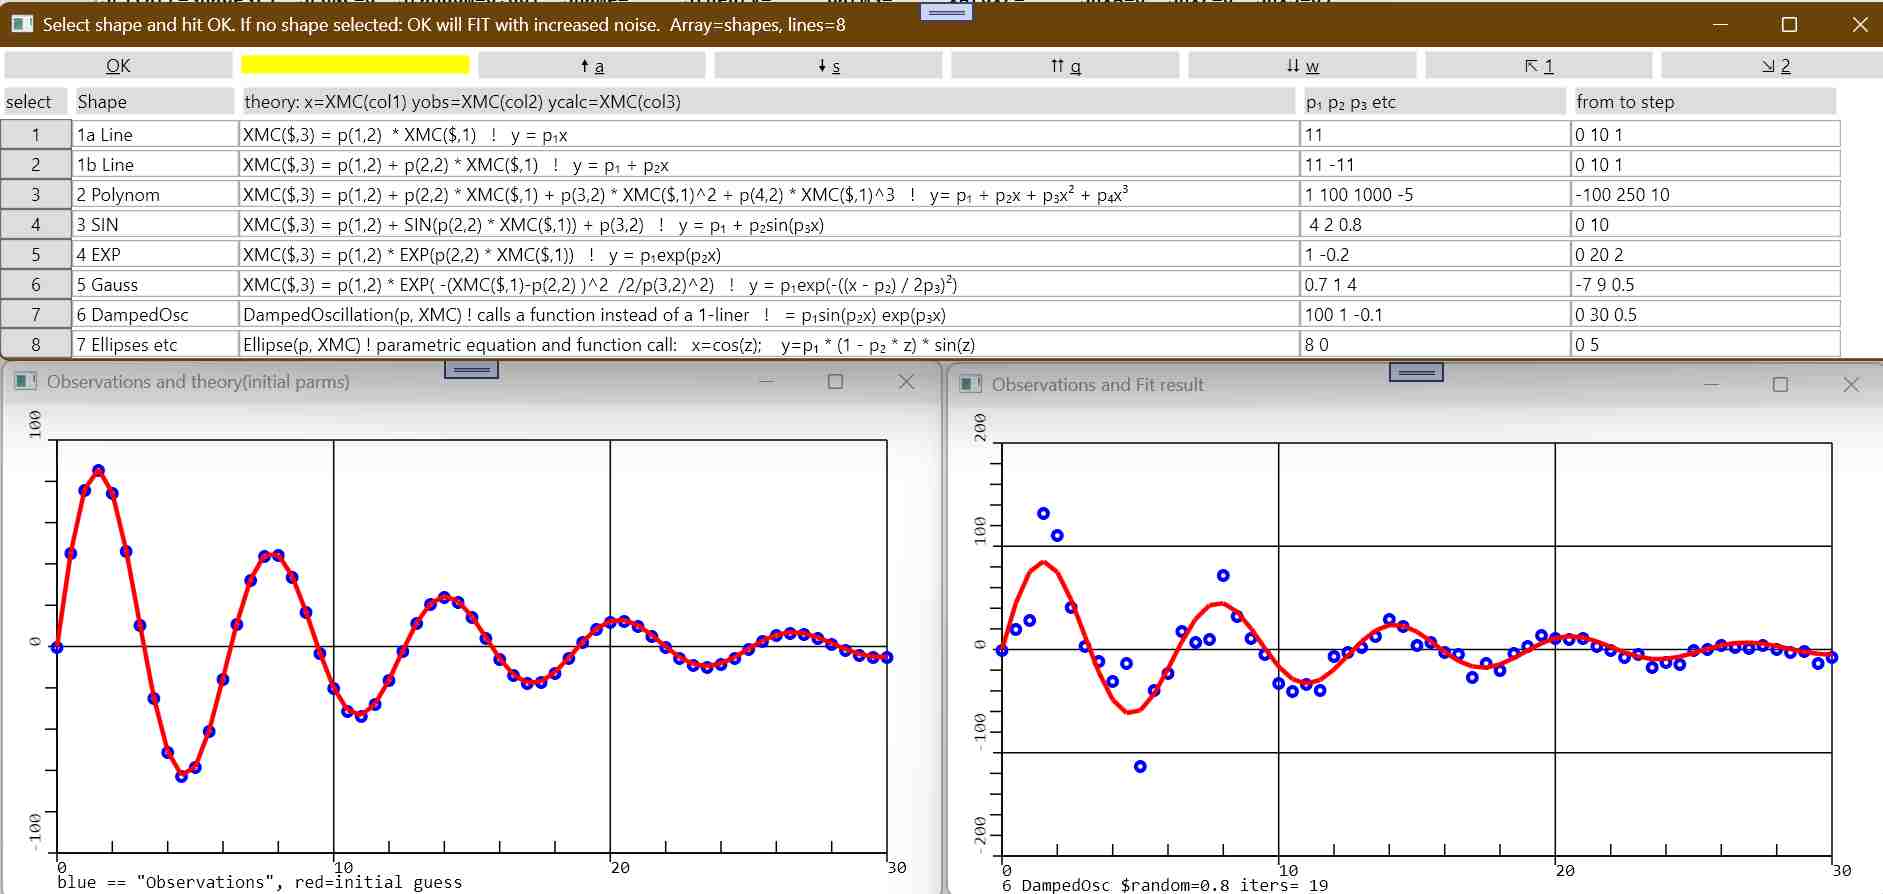
DLG(X=0, TI='Select shape and hit OK. If no shape selected: OK will FIT with increased noise.',
Array=shapes, XEQ='$FUNC=$numRC', TI="select,Shape ,theory: x=XMC(col1) yobs=XMC(col2) ycalc=XMC(col3),p₁ p₂ p₃ etc,from to step", SAVE=0)
IF( $FUNC ) !******************************************************** PLOT ********
ARRAY(Name=p, CLeaR=1, Name=XMC, CLeaR=1)
$random = 0.001
$name = shapes($FUNC,1)
$theory = shapes($FUNC,2)
parms = shapes($FUNC,3)
xAtoxZ = shapes($FUNC,4)
$startAt = DEC(xAtoxZ, 1)
$endAt = DEC(xAtoxZ, 2)
$stepsize = DEC(xAtoxZ, 3)
$stepsize = MAX($stepsize, 0.1)
$np = 1 + EDIT(T=parms, Count=' ')
SAVE("LeastSquareFit.Settings", shapes)
p(1,1) = DEC(parms, 1) ! Start value parm 1
IF($np > 1)
p(2,1) = DEC(parms, 2) ! Start value parm 2
IF($np > 2)
p(3,1) = DEC(parms, 3) ! Start value parm 3
IF($np > 3)
p(4,1) = DEC(parms, 4) ! Start value parm 4
ENDIF
ENDIF
ENDIF
DO i = 1, $np
p(i,2) = 0 ! std dev parm i
DO j = 3, 3+$np-1
p(i,j) = 0 ! correlation parm i / parm j
ENDDO
ENDDO
j = 0
DO i = $startAt, $endAt, $stepsize
j = j + 1
XMC(j,1) = i ! set measured x values in column 1 of array XMC
XMC(j,2) = 0
XMC(j,3) = 0 ! make space for CALCULATED y values in column 3
ENDDO
... DLG(X=0,W=1/2, TI='Make "observations"', Array=p,
... Ti=',Original,1. From these parms make "OBSERVED" data (blue circles in graph)', SAVE=0)
XEQ($theory) ! set CALCULATED y values XMC($,3) = f(p, XMC($,1))
XMC($,2) = XMC($,3) * RAN(1, $random) ! SIMULATE measured y values based on calculated values
XEQ($theory) ! set CALCULATED y values XMC($,3) = f(p, XMC($,1))
SET(xMin=1E100, xMax=-1E100, yMin=1E100, yMax=-1E100)
xMin = MIN(xMin, XMC($,1))
xMax = MAX(xMax, XMC($,1))
yMin = MIN(yMin, XMC($,2), XMC($,3))
yMax = MAX(yMax, XMC($,2), XMC($,3))
IF(yMin < yMax)
DLG(TI='Observations and theory(initial parms)', Rs=2,Cs=2,AX=3,
TI='blue == "Observations", red=initial guess', MIN=xMin,MAX=xMax, Y=1,MIN=yMin,MAX=yMax)
LINE(AX=3, C=1,XV=XMC, C=2,YV=XMC,S='🞉', D=-9)
LINE(AX=3, C=1, XV=XMC, C=3,YV=XMC,W=3, Draw=900)
ENDIF
ELSE
XMC($,2) = XMC($,2) * RAN(1, $random) ! SIMULATE measured noisy y values based on calculated values
IF(INDEX($theory, "Damped") > 0)
$iters = FIT(Resi=res, Theory="DampedOscillation(p,XMC)")
ELSEIF(INDEX($theory, "Ellipse") > 0)
$iters = FIT(Resi=res, Theory="Ellipse(p,XMC)")
ELSE
$iters = FIT(Resi=res, Theory=$theory, Parms=p, XMY=XMC)
ENDIF
ShowResult(XMC)
DLG(X=0, TI='The FIT results. Hit OK to increase noise.' && res, Array=p,
Ti=',p result,+- std dev,corr p1,corr p2,corr p3,corr p4', SAVE=0)
IF($random < 0.1)
$random = 10 * $random
ELSE
$random = 2 * $random
ENDIF
ENDIF
ENDDO
END
FUNCTION ShowResult(XMC)
SET(xMin=1E100, xMax=-1E100, yMin=1E100, yMax=-1E100)
xMin = MIN(xMin, XMC($,1))
xMax = MAX(xMax, XMC($,1))
yMin = MIN(yMin, XMC($,3), XMC($,2))
yMax = MAX(yMax, XMC($,3), XMC($,2))
xTitle = $name && "$random=" & $random && "iters=" && $iters
DLG(TI='Observations and Fit result', Rs=2,Cs=2,AX=4, MIN=xMin, MAX=xMax, TIT=xTitle, Y=0, MIN=yMin, MAX=yMax)
LINE(AX=4, C=1,XV=XMC, C=2,YV=XMC,S='🞉',W=3, D=-9)
LINE(AX=4, Col=1, XV=XMC, Col=3, YV=XMC, W=3, Draw=900)
RETURN 0
END
FUNCTION DampedOscillation(p, XMC)
XMC($,3) = p(1,1) * SIN(p(2,1) * XMC($,1)) * exp(p(3,1) * XMC($,1))
END
FUNCTION Ellipse(p, XMC)
L = INT(LEN(XMC)) ! length x vector
parm(L) = 0 ! make length(parm) == length(x)
parm($) = ($ - 1) * $stepsize
XMC($,1) = COS( parm($) )
XMC($,3) = p(1,1) * (1 - p(2,1) * $) * SIN( parm($) )
END
#Explain
FIT determines the parameters of a a mathematical shape to agree with
some measured data points using the Levenberg-Marquard method.
.1 Plot the data
.2 Think of a mathematical function that might describe the data.
.3 Input/output parameters of FIT:
. array p
. column 1: actual parameters (input)
. column 2: standard deviation (output)
. column 3 etc parameter correlations (output)
. array XMC
. column 1: the independent variable x (input)
. column 2: the observed values M (input)
. column 3 calculated values C (output)
. string Residual (optional output)
. Residual=... lists ((SUM(C - M)^2))^(1/2) / rows(XMC) and iters
. FIT returns the number of iterations performed.
. FIT is called by either
.4a iters = FIT(Theory="mytheory(parameters, Xval_Ymeas_Ycalc)")
. The function mytheory has to calculate the 3rd column of
. Xval_Ymeas_Ycal as a function of parameters and Xval
. (see Functionns DampedOscillation and Ellipse)
. or if Theory can be written as a 1-liner:
.4b iters = FIT(Theory="XMC($,3)=func(XMC,p,$)", Parms=p, XMY=XMC)
. (examples see this sample script)
.5 FIT succeeded if iterations > 0 and
. no NaN (not a number) appear in the correlations table.
###